PLANNING QUALITY
It is important to note that most important baseline document is required as an input to plan quality.

We need to be acquainted with the following in the planning quality phase -
- Gold Plating - Providing Extras to the customer to make then happy. This is not allowed.
- Prevention over Inspection - Its always better to prevent defect than holding inspection to catch them.
- Continuous Improvement - In Japanese companies progress is made with very small steps instead of a huge leap. And this approach is very successful.
- Just In Time ( JIT ) - Most companies do not hold the inventories for long time and get them when required. This makes quality more significant.
- Marginal Analysis - The point where added quality doesn't add any additional value. This point one should stop.
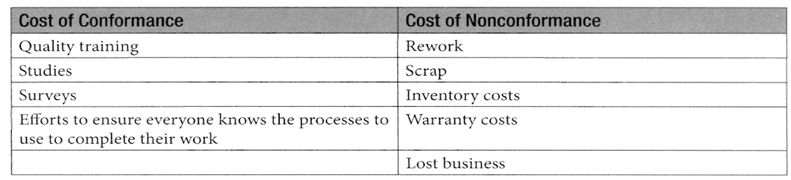
- Cost of quality - The Cost of Conformance should be less that Cost of Non Conformance.
The planning includes determining how to measure the quality -

- Flow Charting - Most common way to measure quality.

- Bench Marking - Using previous projects to use as a Bench Mark for the current project.
- Design Of Experiments ( DOE ) - DOE is a statical method that allows you to systematically change all of the important factors in a process and see which combination has a lower impact on the project. This is faster and more accurate than chnaging one at time.
- Statistical Sampling - Just to use samples to test the quality.
- Flow-charting - A flowcharting shows a process end to end and hence provides visibility to the pottential quality issues.
PERFORM QUALITY ASSURANCE
This
process is to answer the questions like "Are we using the standards
?" "Can we improve the standards ?"
The following ways we can control quality assurance -
- QUALITY AUDIT - Team inspects if the project is complying with the company policies , standards and procedures.
- PROCESS ANALYSIS - Many work / activities get repeated in a project. When few times the activity is done with the lesson learned a process analysis is done to improve the next time when the activity is done.
PERFORM QUALITY CONTROL
There are some basic terms to aware about :
- Mutually Exclusive - Cannot happen together. Flip a coin and it can be either be head or tails.
- Normal Distribution - Most common standard deviation chart like a bell curve.
- Statistical Independence - Probability of one event occuring doesnot impact another event.
- Standard Deviation ( SIGMA ) - A measure of standard deviation. Measure of how far you can be from mean. [ ( P - O ) / 6 ]
+/- 2 Sigma = 95.46 %
+/- 3 Sigma = 99.73 %
The following are the ways to control quality:
 Cause And Effect Diagram
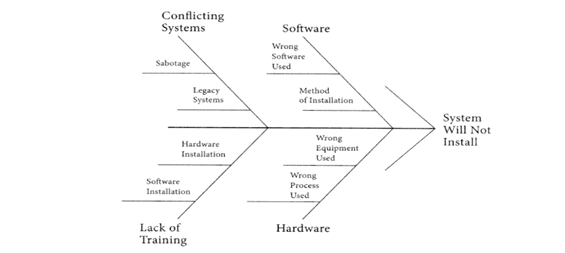
The cause and effect diagram gives a way to understand the route cause of an issue. Helps to solve the issue and provide better decisions.


Flow-charting
A flow-charting shows a process end to end and hence provides visibility to the pottential quality issues.

Histograms
Data in form of bars.
Pareto Chart

Data in form of bars but to indicatr higher priority first.
 Run Chart

Historical data in form of chart.
 Scatter Diagram

Compares two variables.
Control Chart
Explained in Quality Planning
No comments:
Post a Comment